Monitoring OpenMediaVault with Prometheus and Grafana
I have been using OpenMediaVault (OMV) for my personal NAS. It’s running as a Proxmox virtual machine (VM). OMV has built-in monitoring graphs in its Web UI. However, I want to centralize the monitoring of my homelab setup in Grafana.
Exposing collectd metrics⌗
OMV is using collectd for monitoring system performances. From the collectd documentation, there is a built-in plugin called write_prometheus.
What write_prometheus plugin does is exposing a HTTP server for Prometheus to scrape. It uses libmicrohttpd under the hood.
So make sure you install the required library prior to enabling the plugin.
Use SSH and connect to your OMV instance.
Install
libmicrohttpd:apt install libmicrohttpd12Create a file at
/etc/collectd/collectd.conf.d/prometheus.confwith contents as follows:LoadPlugin write_prometheus <Plugin "write_prometheus"> Port "9103" </Plugin>For more settings, consult collectd’s write_prometheus documentation.
Restart the
collectdservice:systemctl restart collectdEnsure the
collectdservice is running:systemctl status collectdTest by making a HTTP request against port 9103.
curl localhost:9103It should output the Prometheus metrics format like follows:
# HELP collectd_cpu_total write_prometheus plugin: 'cpu' Type: 'cpu', Dstype: 'derive', Dsname: 'value'
# TYPE collectd_cpu_total counter
collectd_cpu_total{cpu="0",type="idle",instance="localhost"} 261050639 1725100186601
collectd_cpu_total{cpu="0",type="interrupt",instance="localhost"} 0 1725100186601
collectd_cpu_total{cpu="0",type="nice",instance="localhost"} 1319 1725100186601
collectd_cpu_total{cpu="0",type="softirq",instance="localhost"} 199446 1725100186601
collectd_cpu_total{cpu="0",type="steal",instance="localhost"} 4700 1725100186601
collectd_cpu_total{cpu="0",type="system",instance="localhost"} 1050359 1725100186601
collectd_cpu_total{cpu="0",type="user",instance="localhost"} 1495626 1725100186601
collectd_cpu_total{cpu="0",type="wait",instance="localhost"} 13587615 1725100186601

# ... redacted for brevity

# HELP collectd_uptime write_prometheus plugin: 'uptime' Type: 'uptime', Dstype: 'gauge', Dsname: 'value'
# TYPE collectd_uptime gauge
collectd_uptime{instance="localhost"} 2782594 1725100186611

# collectd/write_prometheus 5.12.0.git at localhost
If you encounter an error, check the
collectdlogs:journalctl -u collectd
After enabling the collectd write_prometheus plugin, you can now configure the Prometheus
to scrape the collectd Prometheus-formatted metrics. Or if you’re using Grafana Alloy like I do in my homelab setup, check the Configuring Grafana Alloy section.
Configuring Prometheus⌗
Sample Prometheus configuration for scraping collectd:
global:
  scrape_interval: 15s
  evaluation_interval: 15s
scrape_configs:
  - job_name: 'collectd'
    static_configs:
      - targets: ['<Your OMV Address>:9103']
Configuring Grafana Alloy⌗
Grafana Alloy’s configuration for scraping collectd and forwarding to Grafana Mimir instance:
prometheus.scrape "collectd" {
  targets = [{
    __address__ = "<Your OMV Address>:9103",
  }]
  forward_to      = [prometheus.remote_write.default.receiver]
  job_name        = "collectd"
  scrape_interval = "15s"
}

prometheus.remote_write "default" {
  endpoint {
    url     = "http://mimir.dhimas.net:8080/api/v1/push"
    headers = {
      "X-Scope-OrgID" = "homelab",
    }

    queue_config { }

    metadata_config { }
  }
}
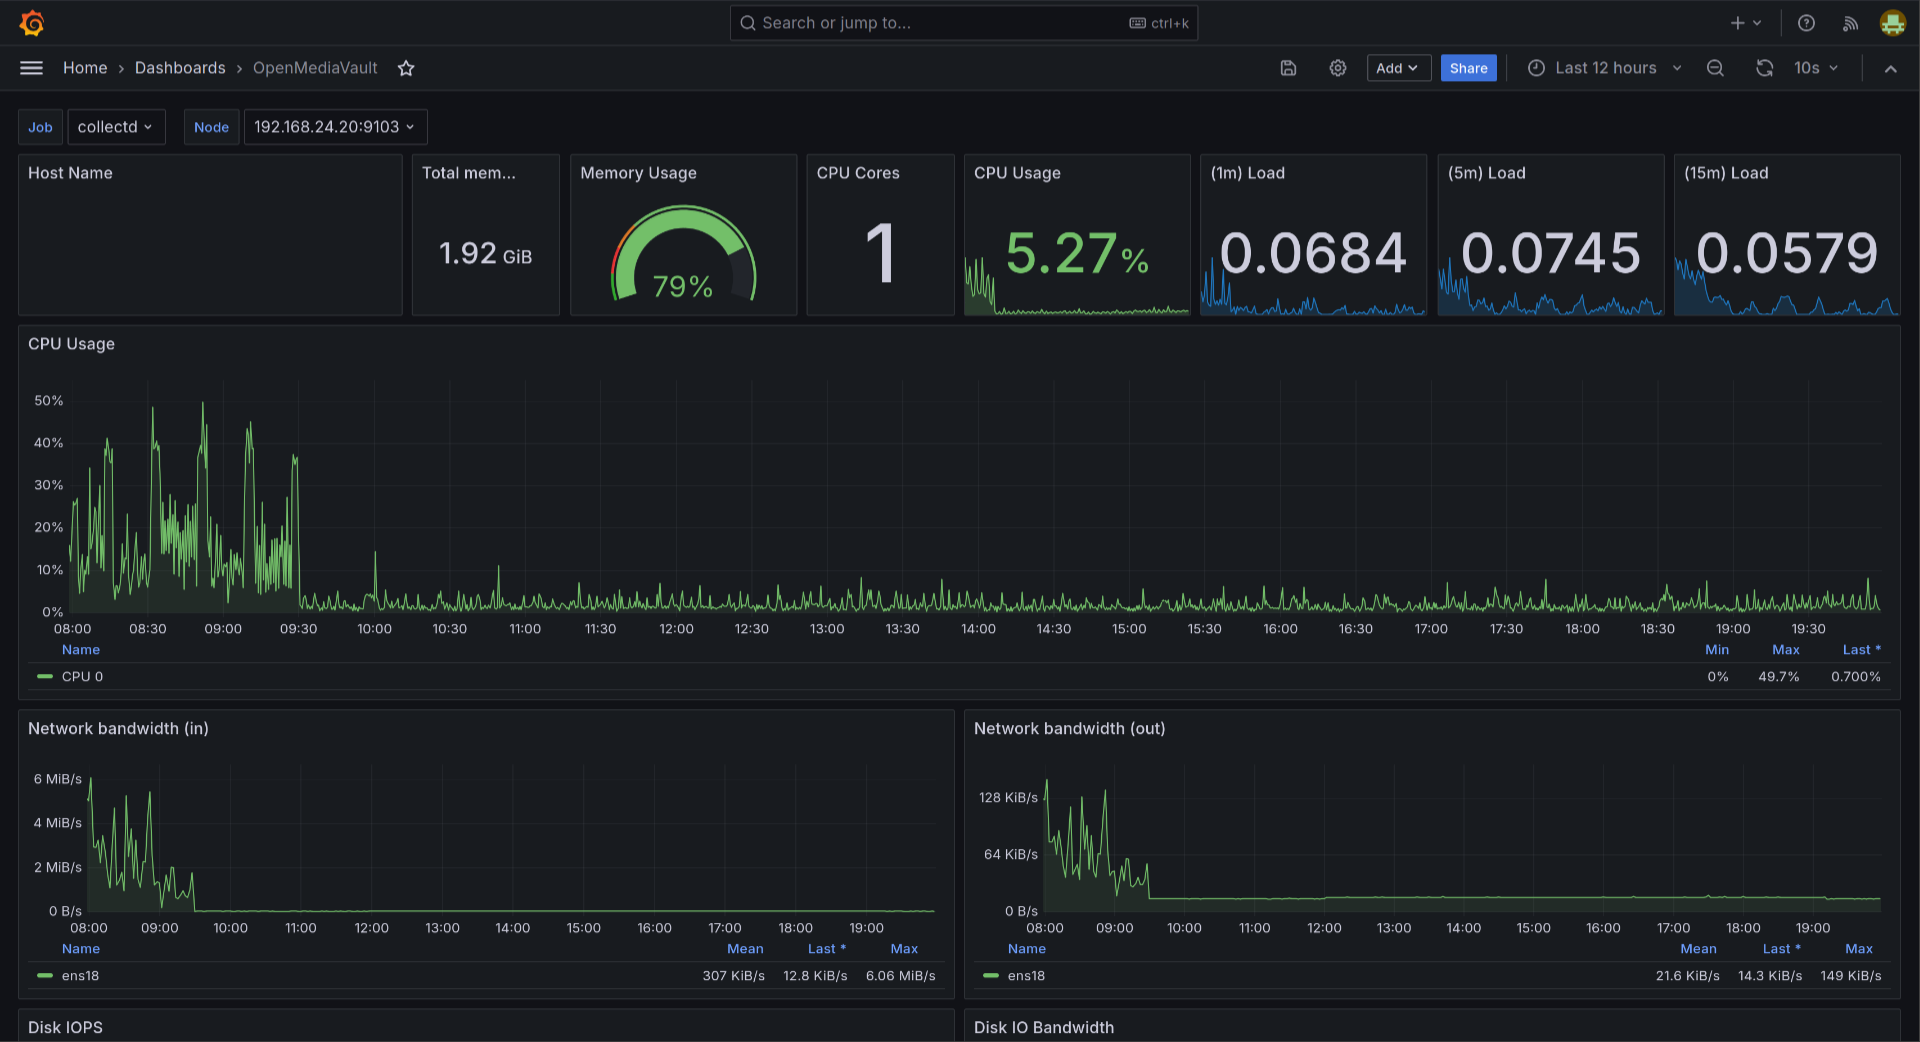
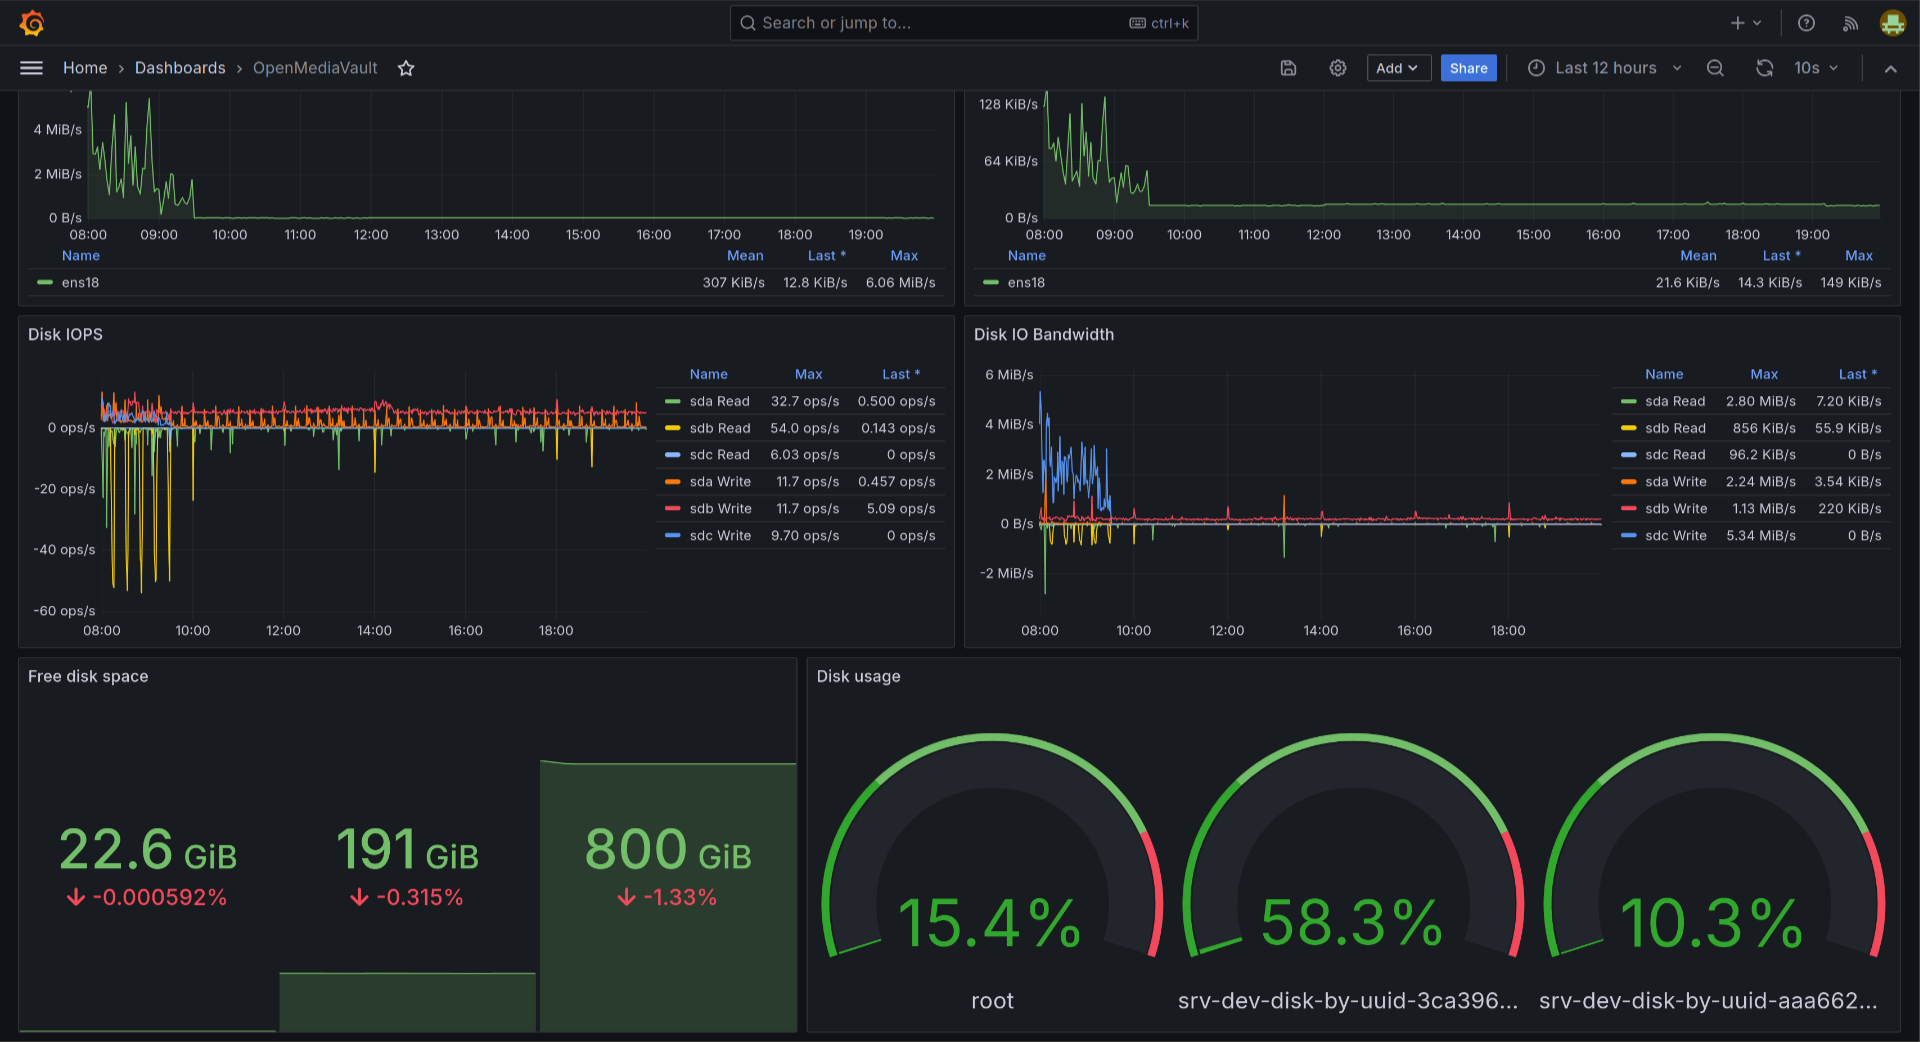
Visualizations in Grafana⌗
All you need to do now is just to create your visualizations in your Grafana dashboard.
I have created simple dashboard for my own. You can find the source code here and import it to your Grafana instance.